
Sri Lanka’s merchandise exports decreased by 8.98 % to US$ 1,001.9 Million in January 2023 compared to January 2022 as per the data released by the Sri Lanka Customs. However, it is a 6.97% increase when compared to January 2021.
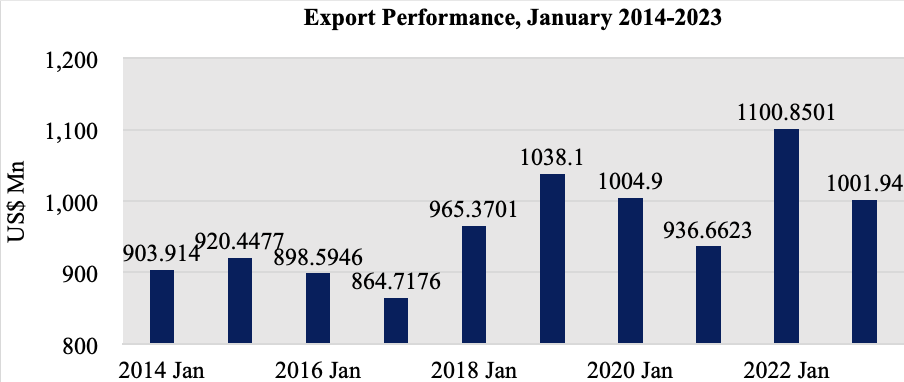
Table 1: Merchandise Export Performance
Values in US$ Mns
| Exports of Goods | Jan 2021 | Jan 2022 | Jan 2023 | % Growth (22-23) |
| Apparel & Textile | 421.28 | 514.39 | 423.13 | -17.74 |
| Tea | 100.99 | 91.22 | 99.56 | 9.14 |
| Rubber-based | 84.16 | 87.12 | 75.89 | -12.89 |
| Coconut-based | 54.18 | 68.27 | 47.90 | -29.84 |
| Diamond, Gems & Jewelery | 28.94 | 25.08 | 46.26 | 84.45 |
| Electronics & Electronic Components | 31.85 | 35.87 | 38.18 | 6.44 |
| Spices and Concentrates | 42.22 | 34.98 | 34.48 | -1.43 |
| Processed Food & Beverages | 31.35 | 30.74 | 32.39 | 5.37 |
| Seafood | 16.90 | 24.11 | 20.94 | -13.15 |
| Ornamental Fish | 0.88 | 1.78 | 2.20 | 23.60 |
| Vegetables | 1.70 | 2.36 | 2.47 | 4.66 |
| Fruits | 2.86 | 3.15 | 3.23 | 2.54 |
| Other Export Crops | 2.47 | 5.34 | 2.13 | -60.11 |
| Flowers & Foliage | 1.09 | 1.22 | 1.16 | -4.92 |
| Boat Building | 0.05 | 0.17 | 0.07 | -58.82 |
| Petroleum Products | 0.46 | 34.02 | 77.84 | 128.81 |
| Others | 115.32 | 141.08 | 94.07 | -33.32 |
| Total Merchandize Exports | 936.70 | 1,100.9 | 1,001.9 | -8.98 |
Sources: CBSL, SL Customs
Table 2: Top 15 Export Destinations
Values in US$ Mns
|
| Country | Jan 2021 | Jan 2022 | Jan 2023 | % Growth (22-23) |
| 1 | United States | 233.53 | 295.25 | 254.78 | -13.71 |
| 2 | United Kingdom | 61.49 | 81.16 | 77.42 | -4.61 |
| 3 | India | 55.65 | 71.72 | 69.58 | -2.98 |
| 4 | Germany | 53.45 | 60.2 | 48.12 | -20.07 |
| 5 | Italy | 53.04 | 49.69 | 46.21 | -7.00 |
| 6 | Netherlands | 34.86 | 38.68 | 26.55 | -31.36 |
| 7 | Canada | 23.83 | 29.82 | 19.57 | -34.37 |
| 8 | UAE | 15.22 | 23.88 | 71.35 | 198.79 |
| 9 | Belgium | 23.70 | 24.78 | 19.57 | -21.03 |
| 10 | France | 20.87 | 23.51 | 17.89 | -23.90 |
| 11 | Australia | 18.40 | 19.14 | 17.81 | -6.95 |
| 12 | China | 21.98 | 18.81 | 19.35 | 2.87 |
| 13 | Japan | 16.55 | 15.92 | 15.37 | -3.45 |
| 14 | Bangladesh | 12.56 | 34.03 | 13.94 | -59.04 |
| 15 | Mexico | 20.39 | 15.21 | 14.51 | -4.60 |
|
| Others | 271.18 | 299.10 | 269.88 | -9.77 |
|
| Total | 936.70 | 1,100.90 | 1,001.90 | -8.99 |
Exports to FTA Partners
During the month of January 2022, exports to Free Trade Agreement (FTA) partners accounted for 7.2% of total merchandise exports decreased by 7.2 % to US$ 74.52 Mn.
Moreover, Exports to India and Pakistan decreased by 2.98% and 42.49% y-o-y to US$ 69.58 Mn and US$ 4.94 Mn respectively during the month of January 2023 compared to January 2022. Decreased Exports to India is mainly led by decreased exports of Pepper (-62.86%) due to the import ban imposed by India.
In addition, poor performance recorded in Pakistan led by Articles of Stones, Textiles & Coconut kernel products.
Sri Lanka’s Export Performance in Regions
Following table shows the comparison of region wise exports during the month of January 2023 compared to January 2022.
Table 3: Export Regions
Values in US$ Mns
| Region | Jan 2021 | Jan 2022 | Jan 2023 | % Growth (22-23) |
| United States | 233.53 | 295.25 | 254.78 | -13.71 |
| European Union (EU) excluding UK | 234.03 | 246.74 | 202.23 | -18.04 |
| South Asia | 81.58 | 122.86 | 96.51 | -21.45 |
| ASEAN | 60.90 | 74.49 | 121.47 | 63.07 |
| CIS Countries | 17.95 | 28.85 | 33.08 | 14.66 |
| African Countries | 19.63 | 24.56 | 27.49 | 11.93 |
| Middle East Countries (excl. Cyprus & Egypt) | 21.04 | 21.30 | 21.21 | -0.42 |
| Others | 268.04 | 286.85 | 245.13 | -14.54 |
| Total Merchandise Exports | 936.70 | 1100.90 | 1001.90 | -8.99 |