
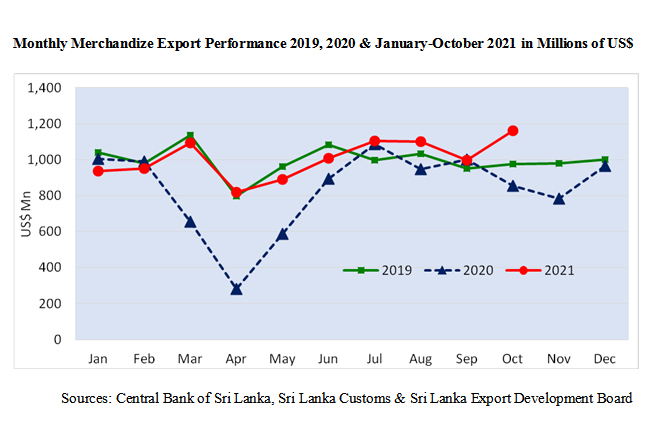
Sri Lanka’s merchandise exports increased by 35.9% to US$ 1,160.62 Million in October 2021 compared to October 2020 as per the data released by the Sri Lanka Customs. Exports maintained above one billion for the fifth time this year.
"This is the highest-ever merchandise export figure in any October in our history," EDB Chairman, Suresh D. de Mel said.
"Opening up of Western markets together with the sustained production in Sri Lanka can be attributed to this increase. I commended our exporters for this outstanding performance during these difficult times.”
Revised Export Target & Achievement
The revised export target of the Export Development Board for 2021 is US$ 15.72 billion and of that EDB expects US$ 12.14 billion from merchandise exports and US$ 3.58 billion from services exports. During the period January to October 2021, earnings from exports recorded US$ 12.6 billion including the estimated services data for July to October and 80 % achieved from the revised export target.
Further, earnings from Merchandise exports and services exports achieved 82.9 % and 70.3% respectively during the period of January to October 2021.
Table 1: Merchandise Export Performance
Values in US$ Mns
| Exports of Goods | Jan-Oct 2019 | Jan-Oct 2020 | Jan-Oct 2021 | % Growth (20-21) | Oct 2020 | Oct 2021 | % Growth (20-21) |
| Apparel & Textile | 4,612.6 | 3,630.4 | 4,388.5 | 20.9 | 356.5 | 509.0 | 42.8 |
| Tea | 1,139.1 | 1,031.8 | 1,096.1 | 6.2 | 112.2 | 109.5 | -2.4 |
| Rubber-based | 753.7 | 667.13 | 896.89 | 34.4 | 80.3 | 91.91 | 14.5 |
| Coconut-based | 520.9 | 550.7 | 684.6 | 24.3 | 62.2 | 77.7 | 24.9 |
| Diamond, Gems & Jewelery | 263.0 | 126.9 | 211.7 | 66.8 | 7.9 | 25.4 | 219.9 |
| Electronics & Electronic Components | 323.8 | 266.7 | 348.0 | 30.5 | 20.5 | 38.4 | 87.3 |
| Spices and Concentrates | 268.0 | 268.3 | 365.7 | 36.3 | 33.8 | 44.9 | 32.8 |
| Processed Food & Beverages | 304.7 | 300.6 | 339.8 | 13.1 | 24.7 | 63.0 | 154.8 |
| Seafood | 219.6 | 165.0 | 212.5 | 28.8 | 15.6 | 24.5 | 57.0 |
| Ornamental Fish | 12.8 | 11.3 | 15.5 | 37.8 | 1.5 | 1.7 | 10.6 |
| Vegetables | 26.7 | 21.8 | 21.4 | -2.2 | 2.1 | 2.7 | 24.8 |
| Fruits | 36.0 | 30.5 | 31.8 | 4.1 | 2.8 | 3.2 | 13.8 |
| Other Export Crops | 30.0 | 63.8 | 55.8 | -12.6 | 3.0 | 7.4 | 145.7 |
| Flowers & Foliage | 15.7 | 11.1 | 13.1 | 18.1 | 1.3 | 1.8 | 44.4 |
| Boat Building | 65.2 | 2.0 | 36.6 | 1703.9 | 0.0 | 33.7 | 112200.0 |
| Petroleum Products | 288.7 | 267.3 | 180.6 | -32.4 | 10.1 | 16.7 | 65.4 |
| Others | 1,079.9 | 883.9 | 1,160.8 | 31.3 | 119.8 | 109.1 | -8.9 |
| Total Merchandize Exports | 9,960.4 | 8,299.2 | 10,059.4 | 21.2 | 854.3 | 1,160.6 | 35.9 |
Table 2: Top 10 Export Destinations
| Country | Jan-Oct 2020 | Jan-Oct 2021 | % Growth (20-21) | Oct 2020 | Oct 2021 | % Growth (20-21) | |
| 1 | United States | 2,089.2 | 2,466.7 | 18.1 | 197.1 | 291.3 | 47.8 |
| 2 | United Kingdom | 766.7 | 768.0 | 0.2 | 102.5 | 88.5 | -13.7 |
| 3 | India | 498.8 | 644.6 | 29.2 | 45.1 | 77.6 | 72.1 |
| 4 | Germany | 479.0 | 609.7 | 27.3 | 49.0 | 64.8 | 32.3 |
| 5 | Italy | 371.6 | 480.6 | 29.3 | 41.3 | 61.9 | 49.7 |
| 6 | Netherlands | 232.4 | 346.3 | 49.0 | 29.9 | 40.3 | 34.5 |
| 7 | Belgium | 237.7 | 272.7 | 14.7 | 24.9 | 29.6 | 19.1 |
| 8 | Canada | 172.6 | 255.3 | 47.9 | 16.0 | 26.5 | 66.0 |
| 9 | China | 178.0 | 228.0 | 28.1 | 18.7 | 20.3 | 8.6 |
| 10 | UAE | 160.5 | 229.2 | 42.8 | 14.3 | 28.2 | 97.5 |
| Others | 3,112.7 | 3,758.3 | 20.7 | 315.6 | 431.7 | 36.8 | |
| Total | 8,299.2 | 10,059.4 | 21.2 | 854.3 | 1,160.6 | 35.9 |
Exports to FTA Partners
During the period of January to October 2021, exports to Free Trade Agreement (FTA) partners accounted for 7.2% of total merchandise exports increased by 28.8% to US$ 720.3 Mn.
Moreover, Exports to India and Pakistan increased by 29.2% and 24.9% y-o-y to US$ 644.6 Mn and US$ 75.4 Mn respectively during the first ten months of 2021. Increased Exports to India is mainly supported by increased exports of Animal Feed (15.1%), Pepper (162.3%), Woven fabrics (1712%) and Bicycles Not Motorized (287.9%) in the first ten months of 2021.
In addition, better performance recorded in Pakistan led by Sheet Rubber, Desiccated Coconut, Other Articles of Stones, Woven Fabrics and Perfumes, Cosmetics, Shampoos & Makeup Preparations.
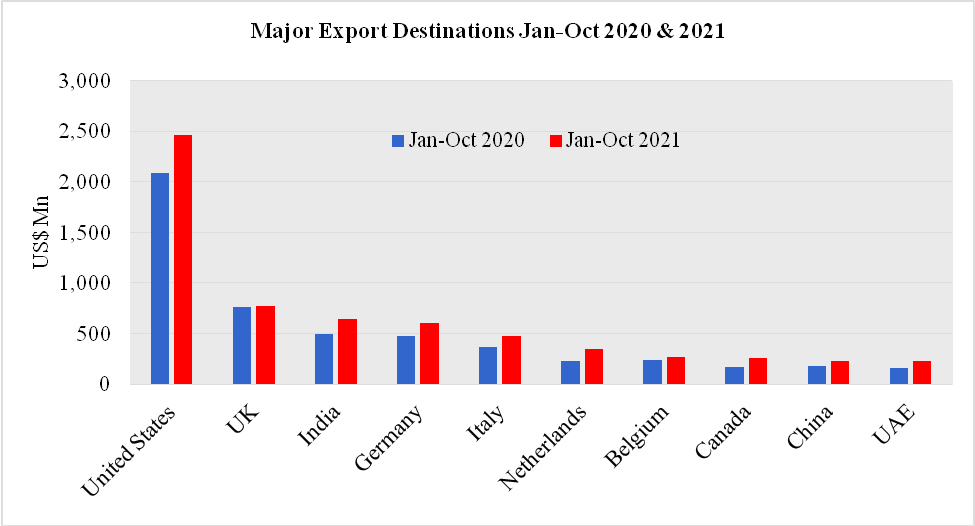
Table 3: Export Regions
| Region | Jan-Oct 2020 | Jan-Oct 2021 | % Growth (20-21) | Oct 2020 | Oct 2021 | % Growth (20-21) |
| European Union (EU) excluding UK | 1,865.4 | 2,397.6 | 28.5 | 204.4 | 275.2 | 34.7 |
| United States | 2,089.2 | 2,466.7 | 18.1 | 197.1 | 291.3 | 47.8 |
| South Asia | 764.1 | 992.4 | 29.9 | 70.6 | 119.3 | 69.0 |
| ASEAN | 242.3 | 266.2 | 9.9 | 19.6 | 29.5 | 50.9 |
| CIS Countries | 230.1 | 209.1 | -9.1 | 25.7 | 20.4 | -20.8 |
| African Countries | 207.4 | 260.5 | 25.6 | 18.2 | 28.5 | 56.4 |
| Middle East Countries (excl. Cyprus & Egypt) | 593.3 | 747.5 | 26.0 | 51.4 | 122.5 | 138.4 |
| Others | 2,307.4 | 2,719.4 | 17.9 | 267.3 | 273.9 | 2.5 |
| Total Merchandise Exports | 8,299.2 | 10,059.4 | 21.2 | 854.3 | 1,160.6 | 35.9 |
Export of Services
The estimated value of services exports for the period of January to October 2021 was 2,521.1 Million dollars, increasing 28.5 % over the corresponding period of 2020. The services exports estimated by EDB consists of ICT/BPM, Construction, Financial services and Transport & Logistics.