
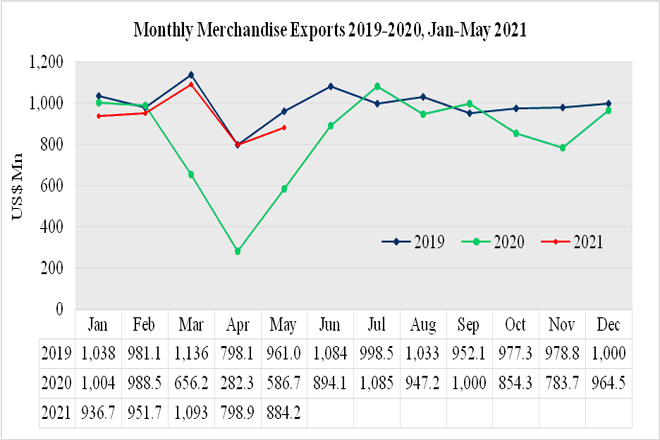
Sri Lanka’s export sector performance has been able to manage its growth momentum in May 2021 with the challenges of the Covid-19 pandemic.
As per the statistics released by Sri Lanka Customs, Sri Lanka’s merchandise exports in May 2021 were US$ 884.2 Million, an increase of 50.71% over US$ 586.7 Million in May 2020.
Sri Lanka’s merchandise exports in January-May 2021 was US$ 4,583.56 Million, an increase of 32.61% over US$ 3,456.32 Million in January-May 2020.
Merchandise Export Performance Values in US$ Mns
| Exports of Goods | Jan-May 2019 | Jan-May 2020 | Jan-May 2021 | % Growth (20-21) | May 2020 | May 2021 | % Growth (20-21) |
| Apparel | 2,248.68 | 1,534.61 | 2,064.17 | 34.51 | 218.83 | 370.87 | 69.48 |
| Tea | 571.77 | 456.72 | 526.62 | 15.30 | 108.28 | 109.23 | 0.88 |
| Rubber-based products | 376.33 | 280.31 | 424.47 | 51.43 | 51.19 | 91.18 | 78.12 |
| Coconut-based products | 259.50 | 216.63 | 317.19 | 46.42 | 51.80 | 66.71 | 28.78 |
| Electronics & Electronic Components | 162.26 | 113.07 | 164.28 | 45.29 | 21.66 | 35.19 | 62.47 |
| Spices and Concentrates | 119.65 | 82.77 | 162.01 | 95.74 | 19.29 | 25.24 | 30.84 |
| Food & Beverages | 158.57 | 124.70 | 147.66 | 18.41 | 23.88 | 30.23 | 26.59 |
| Diamond, Gems & Jewelery | 134.50 | 61.04 | 107.04 | 75.36 | 6.61 | 14.19 | 114.67 |
| Seafood | 122.18 | 74.79 | 90.60 | 21.14 | 11.53 | 15.05 | 30.53 |
| Ornamental Fish | 6.91 | 4.40 | 5.94 | 35.00 | 0.46 | 0.90 | 95.65 |
| Other Export Crops | 11.82 | 29.85 | 23.53 | -21.17 | 5.08 | 4.53 | -10.83 |
| Vegetables | 13.53 | 9.66 | 9.57 | -0.93 | 1.75 | 1.74 | -0.57 |
| Fruits | 17.97 | 14.19 | 14.82 | 4.44 | 2.83 | 2.84 | 0.35 |
| Flowers & Foliage | 8.36 | 5.16 | 5.69 | 10.27 | 0.80 | 0.94 | 17.50 |
| Boat Building | 2.86 | 1.33 | 1.48 | 11.28 | 0.42 | 0.53 | 26.19 |
| Petroleum Products | 133.45 | 141.01 | 51.12 | -63.75 | 27.07 | 27.71 | 2.36 |
| Others | 497.38 | 306.08 | 467.37 | 52.70 | 35.22 | 87.14 | 147.42 |
| Total Merchandize Exports | 4,845.72 | 3,456.32 | 4,583.56 | 32.61 | 586.70 | 884.22 | 50.71 |
Top 10 Export Destinations
| Country | Jan-May 2020 | Jan-May 2021 | % Growth (20-21) | May 2020 | May 2021 | % Growth (20-21) | |
| 1 | United States | 905.10 | 1,133.71 | 25.26 | 145.51 | 213.11 | 46.46 |
| 2 | United Kingdom | 296.21 | 366.53 | 23.74 | 42.56 | 72.29 | 69.85 |
| 3 | India | 220.53 | 302.63 | 37.23 | 38.08 | 55.28 | 45.17 |
| 4 | Germany | 195.85 | 286.00 | 46.03 | 35.63 | 53.80 | 51.00 |
| 5 | Italy | 135.66 | 226.02 | 66.61 | 18.09 | 40.45 | 123.60 |
| 6 | Belgium | 94.35 | 132.18 | 40.10 | 15.65 | 26.71 | 70.67 |
| 7 | Netherlands | 88.16 | 162.10 | 83.87 | 16.56 | 27.11 | 63.71 |
| 8 | China | 71.21 | 116.96 | 64.25 | 12.96 | 20.91 | 61.34 |
| 9 | Canada | 71.92 | 114.98 | 59.87 | 12.73 | 20.47 | 60.80 |
| 10 | Turkey | 68.27 | 81.43 | 19.28 | 15.72 | 15.98 | 1.65 |
| Other Markets | 1,309.07 | 1,661.04 | 26.89 | 233.21 | 338.11 | 44.98 | |
| Total Merchandise Exports | 3456.32 | 4583.56 | 32.61 | 586.70 | 884.22 | 50.71 |
Export Regions
| Region | Jan-May 2020 | Jan-May 2021 | % Growth (20-21) | May 2020 | May 2021 | % Growth (20-21) |
| EU excluding UK | 741.95 | 1,135.99 | 53.11 | 128.84 | 210.05 | 63.03 |
| United States | 905.10 | 1,133.71 | 25.26 | 145.51 | 213.11 | 46.46 |
| South Asia | 333.13 | 455.88 | 36.85 | 50.58 | 94.87 | 87.56 |
| ASEAN Countries | 80.79 | 123.63 | 53.03 | 14.94 | 23.58 | 57.83 |
| CIS Countries | 118.30 | 112.52 | -4.89 | 16.60 | 22.94 | 38.19 |
| African Countries | 102.96 | 102.58 | -0.37 | 22.99 | 20.01 | -12.96 |
| Middle East Countries (Excl. Cyprus & Egypt) | 278.86 | 310.32 | 11.28 | 62.14 | 66.39 | 6.84 |
| Others | 895.23 | 1,208.93 | 35.04 | 145.10 | 233.27 | 60.76 |
| Total Merchandise Exports | 3456.32 | 4583.56 | 32.61 | 586.70 | 884.22 | 50.71 |
Export of Services
The services exports estimated by EDB which includes ICT/BPM, Construction, Financial Services, and Transport & Logistics show exports of US $ 1,194.3 Mn for the period of January to April 2021 compared to US$ 1,021.9 Mn recorded in the corresponding period of 2020.
Estimated service exports increased by 16.87 % in the first four months of 2021 compared to the corresponding period of 2020.