

Nov 13, 2020 (LBO) – As per the Customs statistics, earnings from merchandise exports have recorded a negative growth of 14.9% in October 2020 to US$ 831.72 Mn as compared to the value of US$ 977.3 Mn recorded in October 2019 amidst the adverse impact of 2nd wave of Covid 19 pandemic within the country and globally.
Increases in exports were recorded only in the Europe Region (6.45 %) in October 2020 compared to October 2019.
Moreover, earnings from merchandise exports absorbed by the United Kingdom in October 2020 increased by 38.93 % compared with the value recorded in October 2019.
“It is concerning to see a sharp reduction in exports in October due to the C19 eruption in Sri Lanka which has had a direct impact on our manufacturing and export facilities. The exporters order book is full for the rest of the year and the businesses need to be agile to manage through the C19 disruption," Export Development Board (EDB) Chairman Prabhash Subasinghe said.
"European markets have moved into a lockdown phase and the USA has also reported very high C19 numbers, this will have a significant impact on our market access. Our exporters will need to navigate this uncharted territory in order to maintain business continuity.”
Revised Export Target & Achievement
The revised export target of the Export Development Board for 2020 is US$ 13.39 billion and of that, they expect US$ 9.57 billion from merchandise exports and US$ 3.82 billion from services exports.
During the period January to October 2020, earnings from exports recorded US$ 10.81 billion including the estimated services data for July to October and 80.75% achieved from the revised export target.
During the period January to October 2020, earnings from exports recorded US$ 10.81 billion including the estimated services data for July to October and 80.75% achieved from the revised export target.
Further, earnings from Merchandise exports and services exports achieved 86.02 % and 67.53% respectively during the period of January to October 2020.
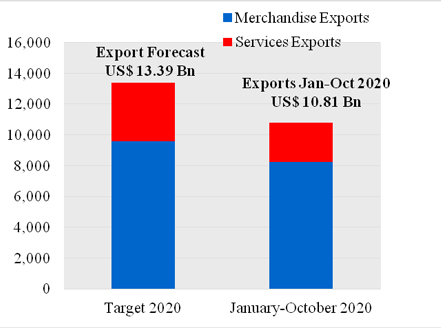
Table 1: Merchandise Export Performance (Values in US$ Mns)
| Exports of Goods | Jan.- Oct 2019 | Jan.- Oct 2020 | % Growth | Oct 2019 | Oct 2020 | % Growth |
| Apparel | 4,612.63 | 3,630.41 | -21.29 | 439.79 | 356.52 | -18.93 |
| Tea | 1,139.14 | 1,031.78 | -9.42 | 113.79 | 112.22 | -1.38 |
| Rubber-based | 753.71 | 667.14 | -11.49 | 71.44 | 80.30 | 12.40 |
| Coconut-based | 523.37 | 552.74 | 5.61 | 50.52 | 62.47 | 23.65 |
| Diamond, Gems & Jewelery | 263.13 | 126.94 | -51.76 | 24.61 | 7.94 | -67.74 |
| Electricals & Electronic Components | 323.83 | 266.71 | -17.64 | 32.79 | 20.49 | -37.51 |
| Spices and Concentrates | 268.06 | 268.33 | 0.10 | 32.59 | 33.80 | 3.71 |
| Food & Beverages | 304.73 | 300.56 | -1.37 | 34.85 | 24.73 | -29.04 |
| Seafood | 219.58 | 164.96 | -24.87 | 19.20 | 15.57 | -18.91 |
| Ornamental Fish | 12.85 | 11.26 | -12.37 | 1.46 | 1.51 | 3.42 |
| Vegetables | 26.70 | 21.82 | -18.28 | 2.89 | 2.14 | -25.95 |
| Fruits | 36.05 | 30.55 | -15.26 | 4.37 | 2.84 | -35.01 |
| Other Export Crops | 30.03 | 63.77 | 112.35 | 5.55 | 2.99 | -46.13 |
| Flowers & Foliage | 15.64 | 11.07 | -29.22 | 1.29 | 1.26 | -2.33 |
| Boat Building | 65.24 | 2.03 | -96.89 | 0.80 | 0.03 | -96.25 |
| Petroleum Products | 347.48 | 291.53 | -16.10 | 49.88 | 11.35 | -77.25 |
| Others | 907.00 | 791.61 | -12.72 | 91.48 | 95.56 | 4.46 |
| Total Merchandize Exports | 9,849.17 | 8,233.21 | -16.41 | 977.30 | 831.72 | -14.90 |
Sources: Sri Lanka Customs / Sri Lanka Export Development Board
Table 2: Sri Lanka’s Top 10 Export Destinations (Values in US$ Mns)
| Country | Jan.- Oct 2019 | Jan.- Oct 2020 | % Growth | Oct 2019 | Oct 2020 | % Growth |
| United States | 2589.45 | 2089.20 | -19.32 | 252.16 | 197.06 | -21.85 |
| United Kingdom | 848.48 | 766.72 | -9.64 | 73.79 | 102.52 | 38.93 |
| India | 642.92 | 498.79 | -22.42 | 66.57 | 45.12 | -32.22 |
| Germany | 541.71 | 478.96 | -11.58 | 49.58 | 48.96 | -1.25 |
| Italy | 445.69 | 371.58 | -16.63 | 47.43 | 41.34 | -12.84 |
| Belgium | 291.13 | 237.72 | -18.35 | 30.87 | 24.85 | -19.50 |
| Netherlands | 241.29 | 232.42 | -3.68 | 23.89 | 29.94 | 25.32 |
| China | 188.01 | 178.00 | -5.32 | 17.56 | 18.72 | 6.61 |
| Turkey | 174.42 | 173.30 | -0.64 | 17.04 | 19.38 | 13.73 |
| Canada | 200.76 | 172.58 | -14.04 | 17.31 | 15.96 | -7.80 |
| Other Markets | 3685.31 | 3033.94 | -17.67 | 381.10 | 287.87 | -24.46 |
| Total | 9849.17 | 8233.21 | -16.41 | 977.30 | 831.72 | -14.90 |
Sources: Sri Lanka Customs / Sri Lanka Export Development Board
Table 3: Sri Lanka’s Export Regions (Values in US$ Mns)
| Region | Jan.- Oct 2019 | Jan.- Oct 2020 | % Growth | Oct 2019 | Oct 2020 | % Growth |
| European Union | 2,976.41 | 2,632.10 | -11.57 | 288.26 | 306.86 | 6.45 |
| United States | 2,589.45 | 2,089.20 | -19.32 | 252.16 | 197.06 | -21.85 |
| South Asia | 940.85 | 764.05 | -18.79 | 100.93 | 70.57 | -30.08 |
| Asean Countries | 343.45 | 242.26 | -29.46 | 32.75 | 25.73 | -21.44 |
| CIS Countries | 234.36 | 230.07 | -1.83 | 26.8 | 19.56 | -27.01 |
| African Countries | 219.93 | 207.36 | -5.72 | 19.57 | 18.2 | -7.00 |
| Middle East Countries (Excl. Cyprus & Egypt) | 764.89 | 593.25 | -22.44 | 84.42 | 51.39 | -39.13 |
| Others | 1,779.83 | 1,474.92 | -17.13 | 172.41 | 142.35 | -17.44 |
| Total Merchandise Exports | 9,849.17 | 8,233.21 | -16.41 | 977.30 | 831.72 | -14.90 |
Sources: Sri Lanka Customs / Sri Lanka Export Development Board