
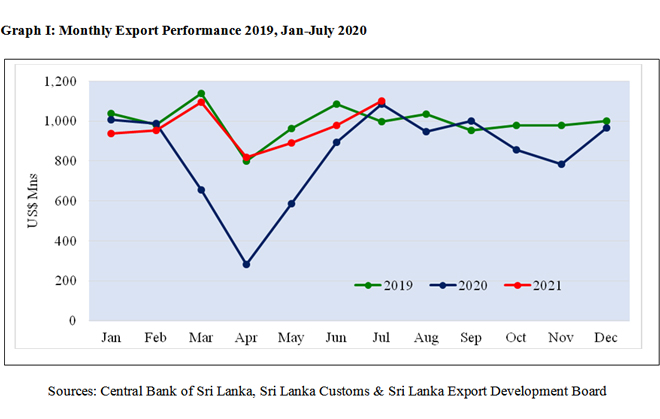
Sri Lanka’s exports have surpassed the $ 1 billion mark in July after four months’ time period where a similar achievement was recorded in March during this year.
As per the figures released by the Sri Lanka Customs, Sri Lanka recorded exports worth US$ 1,099.41 million in July 2021, the highest ever monthly achievement, which showed an increase of 1.33% over US$ 1,085 million in July 2020 and an increase of 12.39 percent over US$ 978.2 million in July 2019.
Export Development Board (EDB) Chairman Suresh D de Mel said; “Sri Lanka’s exports show a remarkable rise despite the current pandemic situation across the World, thanks to the utmost courage, determination and continuous improvements shown by our exporters in sustaining export business during the pandemic.
Table 1: Merchandise Export Performance
Values in US$ Mns
| Exports of Goods | Jan-July 2019 | Jan-July 2020 | Jan-July 2021 | % Growth (20-21) | July 2020 | July 2021 | % Growth (20-21) |
| Apparel | 3226.11 | 2403.70 | 2930.87 | 21.93 | 467.04 | 452.55 | -3.10 |
| Tea | 796.26 | 702.60 | 765.66 | 8.98 | 130.92 | 115.13 | -12.06 |
| Rubber-based | 535.32 | 434.27 | 616.59 | 41.98 | 85.08 | 96.65 | 13.60 |
| Coconut-based | 370.35 | 356.37 | 464.42 | 30.32 | 74.79 | 76.67 | 2.51 |
| Diamond, Gems & Jewelry | 175.29 | 85.52 | 148.78 | 73.97 | 14.34 | 21.41 | 49.30 |
| Electronics & Electronic Components | 227.99 | 176.26 | 241.45 | 36.99 | 32.16 | 39.46 | 22.70 |
| Spices and Concentrates | 170.69 | 155.71 | 243.62 | 56.46 | 41.23 | 45.96 | 11.47 |
| Food & Beverages | 220.98 | 218.43 | 211.37 | -3.23 | 62.15 | 36.99 | -40.48 |
| Seafood | 163.99 | 117.59 | 146.85 | 24.88 | 18.48 | 40.48 | 119.05 |
| Ornamental Fish | 9.13 | 7.82 | 11.64 | 48.85 | 1.44 | 4.94 | 243.06 |
| Vegetables | 18.38 | 15.52 | 14.66 | -5.54 | 2.68 | 3.68 | 37.31 |
| Fruits | 24.62 | 21.43 | 21.89 | 2.15 | 3.70 | 4.09 | 10.54 |
| Other Export Crops | 17.15 | 49.69 | 32.66 | -34.27 | 10.53 | 6.01 | -42.92 |
| Flowers & Foliage | 11.65 | 7.72 | 9.20 | 19.17 | 1.08 | 2.03 | 87.96 |
| Boat Building | 63.61 | 1.64 | 2.67 | 62.80 | 0.28 | 0.14 | -50.00 |
| Petroleum Products | 196.70 | 205.82 | 115.01 | -44.12 | 35.18 | 50.58 | 43.77 |
| Others | 680.9 | 492.44 | 683.79 | 38.86 | 103.92 | 102.64 | -1.23 |
| Total Merchandize Exports | 6,909.12 | 5,452.53 | 6,661.13 | 22.17 | 1,085.0 | 1,099.41 | 1.33 |
Table 2 : Top 10 Export Destinations
| Country | Jan-July 2020 | Jan-July 2021 | % Growth (20-21) | July 2020 | July 2021 | % Growth (20-21) | |
| 1 | United States | 1,403.54 | 1,631.36 | 16.23 | 256.09 | 276.22 | 7.86 |
| 2 | United Kingdom | 461.7 | 525.35 | 13.79 | 100.1 | 81.17 | -18.91 |
| 3 | India | 339.39 | 429.47 | 26.54 | 61.87 | 68.42 | 10.59 |
| 4 | Germany | 312.57 | 417.81 | 33.67 | 62.29 | 66.89 | 7.38 |
| 5 | Italy | 233.46 | 325.09 | 39.25 | 50.48 | 50.23 | -0.50 |
| 6 | Netherlands | 146.99 | 232.09 | 57.90 | 36.65 | 38.38 | 4.72 |
| 7 | Belgium | 156.75 | 186.54 | 19.00 | 34.18 | 27.00 | -21.01 |
| 8 | Canada | 109.58 | 173.38 | 58.22 | 21.28 | 31.30 | 47.09 |
| 9 | China | 114.66 | 164.62 | 43.57 | 25.31 | 23.94 | -5.41 |
| 10 | UAE | 113.21 | 152.52 | 34.72 | 19.25 | 35.93 | 86.65 |
| Others | 2,060.68 | 2,422.90 | 17.58 | 417.50 | 399.93 | -4.21 | |
| Total | 5,452.53 | 6,661.13 | 22.17 | 1,085.0 | 1,099.41 | 1.33 |
Table 3 : Export Regions
| Region | Jan-July 2020 | Jan-July 2021 | % Growth (20-21) | July 2020 | July 2021 | % Growth (20-21) |
| EU excluding UK | 1205.31 | 1634.23 | 35.59 | 256.54 | 248.84 | -3.00 |
| United States | 1,403.54 | 1,631.36 | 16.23 | 256.09 | 276.22 | 7.86 |
| South Asia | 525.38 | 663.68 | 26.32 | 102.70 | 112.71 | 9.75 |
| Asean Countries | 174.48 | 166.88 | -4.36 | 35.19 | 31.64 | -10.09 |
| CIS Countries | 155.27 | 148.5 | -4.36 | 27.22 | 21.47 | -21.12 |
| African Countries | 140.72 | 178.3 | 26.71 | 33.66 | 24.71 | -26.59 |
| Middle East Countries (Excl. Cyprus & Egypt) | 423.61 | 472.5 | 11.54 | 78.76 | 89.21 | 13.27 |
| Others | 1,424.22 | 1,765.68 | 23.98 | 294.84 | 294.61 | -0.08 |
| Total Merchandise Exports | 5,452.53 | 6,661.13 | 22.17 | 1,085.0 | 1,099.41 | 1.33 |
Export of Services
The services exports estimated by EDB which includes ICT/BPM, Construction, Financial Services, and Transport & Logistics recorded worth of US $ 1,885.88 Mn during the period of January to July 2021 compared to US$ 1,482.41 Mn recorded in the corresponding period of 2020.
Estimated service exports increased by 27.22 % during the period of January to July 2021 compared to the corresponding period of 2020.