

Sri Lanka exports decreased by 2-pct to USD 1,037 Mn in March
Sri Lanka’s merchandise exports decreased by 1.96 % to US$ 1,037.5 Million in March 2023 compared to March 2022. Moreover, it is a 5.14 % decrease when compared to March 2021. Less demand created for major products in major markets due to the current economic situation further continues.
Figure 1: Monthly Merchandise Export Performance 2020- March, 2023
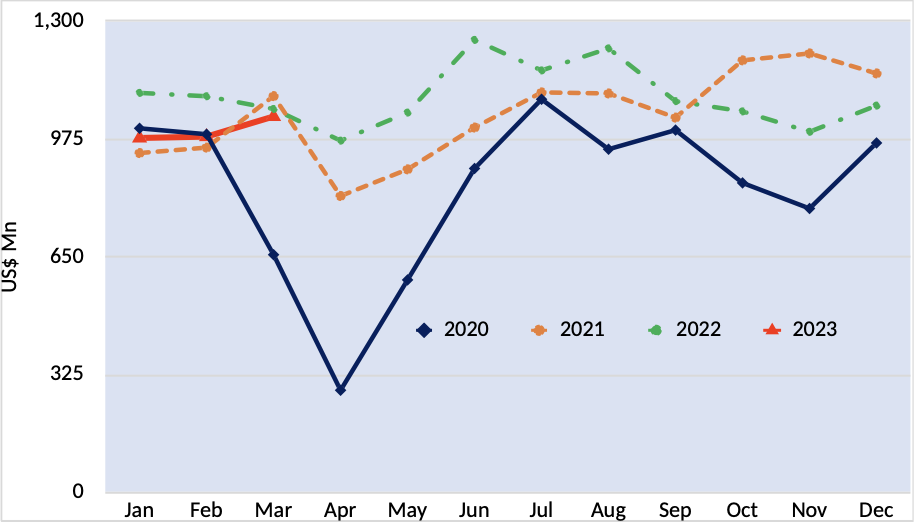
Table 1: Comparison of Product-wise Merchandise Export Performance
Values in US$ Mns
| Exports of Goods | Jan-Mar 2022 | Jan-Mar 2023 | % Growth (22-23) | Mar 2022 | Mar 2023 | % Growth (22-23) |
| Apparel & Textile | 1,472.16 | 1,269.42 | -13.77 | 462.92 | 416.17 | -10.10 |
| Tea | 286.77 | 314.28 | 9.59 | 94.68 | 110.15 | 16.34 |
| Rubber-based | 266.27 | 243.62 | -8.51 | 86.02 | 91.19 | 6.01 |
| Coconut-based | 208.71 | 162.58 | -22.10 | 72.50 | 59.84 | -17.46 |
| Diamond, Gems & Jewelery | 72.70 | 99.99 | 37.54 | 28.15 | 30.90 | 9.77 |
| Electronics & Electronic Components | 112.26 | 126.81 | 12.96 | 38.48 | 45.54 | 18.35 |
| Spices and Concentrates | 85.58 | 101.52 | 18.63 | 23.47 | 32.57 | 38.77 |
| Processed Food & Beverages | 101.53 | 100.22 | -1.29 | 32.79 | 36.41 | 11.04 |
| Seafood | 67.73 | 66.63 | -1.62 | 22.44 | 25.71 | 14.57 |
| Ornamental Fish | 4.81 | 6.58 | 36.80 | 1.58 | 2.38 | 50.63 |
| Vegetables | 6.23 | 7.42 | 19.10 | 2.11 | 2.66 | 26.07 |
| Fruits | 7.83 | 10.45 | 33.46 | 2.57 | 3.89 | 51.36 |
| Other Export Crops | 14.99 | 7.25 | -51.63 | 5.79 | 2.57 | -55.61 |
| Flowers & Foliage | 3.98 | 3.81 | -4.27 | 1.41 | 1.32 | -6.38 |
| Boat Building | 4.77 | 1.03 | -78.41 | 2.54 | 0.62 | -75.59 |
| Petroleum Products | 60.76 | 126.73 | 108.57 | 9.78 | 24.46 | 150.10 |
| Others | 477.09 | 349.26 | -26.79 | 170.97 | 151.12 | -11.61 |
| Total Merchandize Exports | 3,254.17 | 2,997.60 | -7.88 | 1,058.20 | 1,037.5 | -1.96 |
Sources: CBSL, SL Customs
Table 2: Comparison of Merchandise Export Performance of Top 15 Export Destinations
Values in US$ Mns
|
| Destination | Jan-Mar 2022 | Jan-Mar 2023 | % Growth (22-23) | Mar 2022 | Mar 2023 | % Growth (22-23) |
| 1 | United States | 848.63 | 721.70 | -14.96 | 261.14 | 235.87 | -9.68 |
| 2 | United Kingdom | 249.26 | 224.30 | -10.01 | 86.37 | 78.05 | -9.63 |
| 3 | India | 223.01 | 208.57 | -6.48 | 74.05 | 68.85 | -7.02 |
| 4 | Germany | 180.82 | 154.16 | -14.74 | 59.92 | 55.55 | -7.29 |
| 5 | Italy | 149.84 | 158.44 | 5.74 | 46.94 | 58.16 | 23.90 |
| 6 | Netherlands | 102.69 | 83.63 | -18.56 | 30.94 | 29.53 | -4.56 |
| 7 | Canada | 87.38 | 81.56 | -6.66 | 29.87 | 26.76 | -10.41 |
| 8 | UAE | 74.19 | 120.67 | 62.65 | 29.47 | 21.72 | -26.30 |
| 9 | Belgium | 69.10 | 55.67 | -19.44 | 21.63 | 18.30 | -15.40 |
| 10 | France | 64.90 | 57.30 | -11.71 | 21.87 | 22.08 | 0.96 |
| 11 | Australia | 58.85 | 56.39 | -4.18 | 19.72 | 20.89 | 5.93 |
| 12 | China | 64.60 | 61.01 | -5.56 | 20.51 | 20.18 | -1.61 |
| 13 | Japan | 46.70 | 46.28 | -0.90 | 14.88 | 16.54 | 11.16 |
| 14 | Bangladesh | 64.85 | 55.48 | -14.45 | 14.79 | 22.18 | 49.97 |
| 15 | Mexico | 46.29 | 44.16 | -4.60 | 11.91 | 15.39 | 29.22 |
|
| Others | 923.06 | 868.28 | -5.93 | 314.19 | 327.45 | 4.22 |
|
| Total | 3,254.17 | 2,997.60 | -7.88 | 1,058.20 | 1,037.5 | -1.96 |
Sources: CBSL, SL Customs
Table 3: Comparison of Region wise Merchandise Export Performance
Values in US$ Mns
| Region | Jan-Mar 2022 | Jan-Mar 2023 | % Growth (22-23) | Mar 2022 | Mar 2023 | % Growth (22-23) |
| United States | 848.63 | 721.70 | -14.96 | 261.14 | 235.87 | -9.68 |
| European Union (EU) excluding UK | 726.04 | 654.84 | -9.81 | 237.61 | 237.13 | -0.20 |
| South Asia | 338.33 | 308.71 | -8.75 | 105.69 | 108.25 | 2.42 |
| ASEAN | 226.21 | 274.08 | 21.16 | 81.99 | 75.17 | -8.32 |
| CIS Countries | 85.46 | 90.76 | 6.20 | 29.41 | 31.58 | 7.38 |
| African Countries | 70.74 | 85.79 | 21.28 | 20.95 | 29.88 | 42.63 |
| Middle East Countries (excl. Cyprus & Egypt) | 55.36 | 60.87 | 9.95 | 11.52 | 21.40 | 85.76 |
| Others | 903.40 | 800.85 | -11.35 | 309.92 | 298.22 | -3.78 |
| Total Merchandise Exports | 3,254.17 | 2,997.60 | -7.88 | 1,058.20 | 1,037.5 | -1.96 |
Export of Services
The estimated value of services exports for the period of January to March 2023 was US$ 543 Million, increasing 5.8 % over the corresponding period of 2022. The services exports estimated by EDB consists of ICT/BPM, Construction, Financial services and Transport & Logistics.