
Earnings from the merchandise exports increased by 11.87% y-o-y to US$ 915.3 Mn in April 2022, the highest monthly value recorded for the month of April.
This was mainly due to the increase in earnings from the export of Apparel & Textiles, Coconut based products, and Rubber-based products. Further, a sizable increase was recorded in the exports of Electrical & Electronic Components and in the Seafood sector.
Sri Lankan merchandise exports grew to an all-time record for the month of April to US$ 915.3 Mn this year, surpassing the previous high of US$ 799 Mn achieved in 2021, Suresh D de Mel, Chairman - Export Development Board (EDB) said.
It must also be highlighted that efficient facilitation of the supply of fuel and energy to our exporters is imperative to keep this momentum going while appealing for an expedited solution to the current crisis.
Further, we need to focus on niche markets while consolidating the market share in the US and EU. Export product diversification must simultaneously happen so that we can create more billion-dollar industries for Sri Lanka which we are lacking today.”
Monthly Merchandize Export Performance, 2020 - April 2022 in Millions of US$
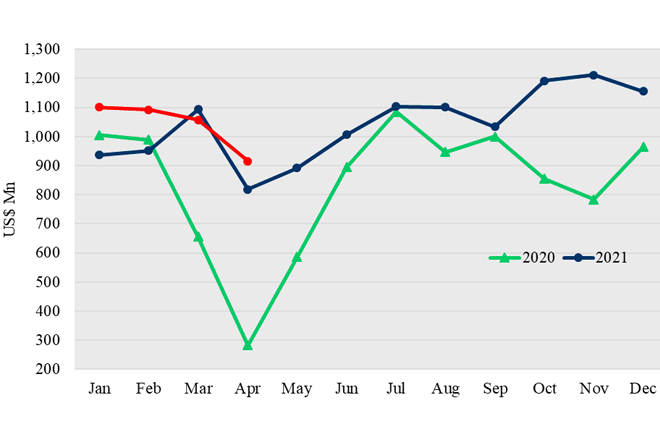
Table 1: Merchandise Export Performance
Values in US$ Mns
| Exports of Goods | Jan-Apr 2020 | Jan-Apr 2021 | Jan-Apr 2022 | % Growth | Apr 2021 | Apr 2022 | % Growth |
| Apparel & Textiles | 1,315.78 | 1,693.31 | 1,917.95 | 13.27 | 365.04 | 445.79 | 22.12 |
| Tea | 348.44 | 417.38 | 367.21 | -12.02 | 79.26 | 80.44 | 1.49 |
| Rubber-based | 229.11 | 333.28 | 337.58 | 1.29 | 64.74 | 71.27 | 10.09 |
| Coconut-based | 164.81 | 250.49 | 279.44 | 11.56 | 55.76 | 70.73 | 26.85 |
| Diamond, Gems & Jewelry | 54.44 | 92.86 | 98.20 | 5.75 | 27.77 | 25.49 | - 8.21 |
| Electronics & Electronic Components | 91.42 | 129.09 | 146.48 | 13.47 | 27.06 | 34.38 | 27.05 |
| Spices and Essential Oils | 63.49 | 136.76 | 107.13 | -21.67 | 22.46 | 21.55 | -4.05 |
| Food & Beverages | 100.82 | 117.44 | 132.47 | 12.80 | 24.60 | 30.92 | 25.69 |
| Seafood | 63.26 | 75.55 | 88.94 | 17.72 | 19.19 | 21.22 | 10.58 |
| Ornamental Fish | 3.94 | 5.03 | 5.83 | 15.90 | 1.25 | 1.03 | -17.60 |
| Vegetables | 7.92 | 7.83 | 7.98 | 1.92 | 1.87 | 1.74 | -6.95 |
| Fruits & Nuts | 11.34 | 11.98 | 10.50 | -12.35 | 2.87 | 2.67 | -6.97 |
| Other Export Crops | 24.77 | 19.00 | 23.28 | 22.53 | 4.84 | 8.28 | 71.07 |
| Flowers & Foliage | 4.37 | 4.74 | 4.94 | 4.22 | 1.02 | 0.95 | -6.86 |
| Boat Building | 0.91 | 0.95 | 5.10 | 436.84 | 0.31 | 0.34 | 9.68 |
| Petroleum Products | 114.41 | 23.42 | 65.07 | 177.84 | 13.46 | 4.30 | -68.05 |
| Others | 332.67 | 481.19 | 567.10 | 17.85 | 106.70 | 94.20 | -11.72 |
| Total Merchandize Exports | 2,931.90 | 3,800.30 | 4,165.20 | 9.60 | 818.20 | 915.30 | 11.87 |
Table 2: Top 10 Export Destinations
Values in US$ Mns
| Country | Jan-Apr 2020 | Jan-Apr 2021 | Jan-Apr 2022 | % Growth | Apr 2021 | Apr 2022 | % Growth | |
| 1 | United States | 759.58 | 920.60 | 1,097.66 | 19.23 | 205.20 | 249.02 | 21.35 |
| 2 | United Kingdom | 253.65 | 294.23 | 333.40 | 13.31 | 68.34 | 84.14 | 23.12 |
| 3 | India | 184.90 | 247.35 | 282.48 | 14.20 | 53.91 | 59.47 | 10.31 |
| 4 | Germany | 157.76 | 232.20 | 247.35 | 6.52 | 52.03 | 66.53 | 27.87 |
| 5 | Italy | 117.57 | 185.57 | 192.42 | 3.69 | 33.52 | 42.57 | 27.00 |
| 6 | Belgium | 78.70 | 105.47 | 95.03 | -9.90 | 22.26 | 25.93 | 16.49 |
| 7 | Netherlands | 71.60 | 134.99 | 130.40 | -3.40 | 28.21 | 27.71 | -1.77 |
| 8 | Canada | 59.19 | 94.51 | 116.06 | 22.80 | 22.37 | 28.68 | 28.21 |
| 9 | China | 58.25 | 96.05 | 79.32 | -17.42 | 18.81 | 14.72 | -21.74 |
| 10 | UAE | 61.62 | 70.17 | 89.19 | 27.11 | 16.33 | 15.00 | -8.14 |
| Other Markets | 1,129.08 | 1,419.16 | 1,501.89 | 5.83 | 297.22 | 301.53 | 1.45 | |
| Total | 2,931.90 | 3,800.30 | 4,165.20 | 9.60 | 818.20 | 915.30 | 11.87 |
Table 3: Export Regions
Values in US$ Mns
| Region | Jan-Apr 2020 | Jan-Apr 2021 | Jan-Apr 2022 | % Growth | Apr 2021 | Apr 2022 | % Growth |
| United States | 759.58 | 920.60 | 1097.66 | 19.23 | 205.20 | 249.02 | 21.35 |
| European Union (EU) excluding UK | 613.11 | 925.95 | 956.94 | 3.35 | 192.43 | 230.91 | 20.00 |
| South Asia | 282.55 | 361.01 | 425.28 | 17.80 | 78.32 | 86.95 | 11.02 |
| Middle East Countries (Excl. Cyprus & Egypt) | 216.71 | 243.93 | 282.45 | 15.79 | 49.17 | 56.25 | 14.40 |
| African Countries | 65.85 | 100.05 | 104.11 | 4.06 | 25.68 | 18.64 | -27.41 |
| Asean Countries | 101.7 | 89.58 | 94.49 | 5.48 | 26.19 | 23.74 | -9.35 |
| CIS Countries | 79.97 | 82.56 | 67.13 | -18.69 | 16.03 | 11.77 | -26.58 |
| Others | 812.43 | 1,076.62 | 1,137.14 | 5.62 | 225.18 | 238.02 | 5.70 |
| Total Merchandise Exports | 2,931.90 | 3,800.30 | 4,165.20 | 9.60 | 818.20 | 915.30 | 11.87 |
Export of Services
The estimated value of services exports for the period of January to April 2022 was 1,188.8 Million dollars, increasing 96.2 % over the corresponding period of 2021. The services exports estimated by EDB consist of ICT/BPM, Construction, Financial Services, and Transport & Logistics.