
Earnings from the merchandise exports decreased by 8.18 % y-o-y to US$ 1,094.8 Mn in October 2022 as per the data released by Sri Lanka Customs.
This was mainly due to the decrease in export earnings from Apparel & Textiles, Tea, Rubber based Products, Coconut based Products, Spices & Essential Oils, and the Fisheries sector. Further, the impact of the global crisis also affects decreased export earnings of major products.
Monthly Merchandize Export Performance, 2020 - October 2022 in Millions of US$
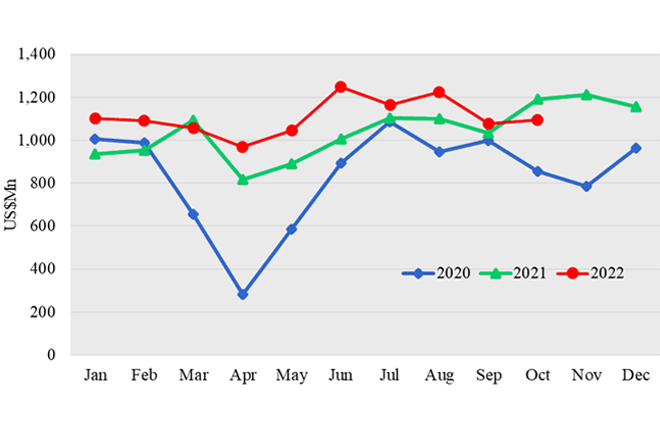
Table 1: Merchandise Export Performance
Values in US$ Mns
| Exports of Goods | Jan-Oct 2020 | Jan-Oct 2021 | Jan-Oct 2022 | % Growth | Oct 2021 | Oct 2022 | % Growth |
| Apparel & Textiles | 3,630.44 | 4,388.48 | 5,004.58 | 14.04 | 509.02 | 441.89 | -13.19 |
| Tea | 1,031.78 | 1,096.11 | 1,045.84 | -4.59 | 109.53 | 108.70 | -0.76 |
| Rubber-based | 667.13 | 896.89 | 874.18 | -2.53 | 91.91 | 86.30 | -6.10 |
| Coconut-based | 552.74 | 686.74 | 710.97 | 3.53 | 77.96 | 72.41 | -7.12 |
| Diamond, Gems & Jewelry | 126.94 | 212.44 | 337.97 | 59.09 | 25.40 | 44.28 | 74.33 |
| Electronics & Electronic Components | 266.71 | 347.99 | 400.32 | 15.04 | 38.38 | 46.26 | 20.53 |
| Spices and Essential Oils | 268.33 | 365.71 | 311.63 | -14.79 | 44.90 | 36.39 | -18.95 |
| Food & Beverages | 300.55 | 339.83 | 349.71 | 2.91 | 63.02 | 30.52 | -51.57 |
| Seafood | 164.96 | 212.49 | 224.88 | 5.83 | 24.45 | 19.56 | -20.00 |
| Ornamental Fish | 11.26 | 15.52 | 17.37 | 11.92 | 1.67 | 1.82 | 8.98 |
| Vegetables | 21.82 | 21.35 | 22.91 | 7.31 | 2.68 | 2.36 | -11.94 |
| Fruits & Nuts | 30.55 | 31.79 | 30.92 | -2.74 | 3.23 | 3.76 | 16.41 |
| Other Export Crops | 63.77 | 55.75 | 82.84 | 48.59 | 7.37 | 8.46 | 14.79 |
| Flowers & Foliage | 11.07 | 13.08 | 12.59 | -3.75 | 1.81 | 1.18 | -34.81 |
| Boat Building | 2.03 | 36.62 | 16.60 | -54.67 | 33.69 | 9.99 | -70.35 |
| Petroleum Products | 267.24 | 180.56 | 220.25 | 21.98 | 16.72 | 79.30 | 374.28 |
| Others | 881.88 | 1,229.48 | 1,412.44 | 14.88 | 140.56 | 101.62 | -27.70 |
| Total Merchandize Exports | 8,299.20 | 10,130.83 | 11,076.00 | 9.33 | 1,192.3 | 1,094.8 | -8.18 |
Table 2: Top 15 Export Destinations
Values in US$ Mns
| Country | Jan-Oct 2020 | Jan-Oct 2021 | Jan-Oct 2022 | % Growth | Oct 2021 | Oct 2022 | % Growth | |
| 1 | United States | 2,089.20 | 2,466.74 | 2,822.89 | 14.44 | 291.28 | 239.98 | -17.61 |
| 2 | United Kingdom | 766.72 | 768.04 | 829.15 | 7.96 | 88.49 | 70.22 | -20.65 |
| 3 | India | 498.79 | 644.57 | 725.85 | 12.61 | 77.63 | 83.82 | 7.97 |
| 4 | Germany | 478.96 | 609.69 | 633.81 | 3.96 | 64.76 | 65.88 | 1.73 |
| 5 | Italy | 371.58 | 480.58 | 535.84 | 11.50 | 61.89 | 58.59 | -5.33 |
| 6 | Netherlands | 232.42 | 346.28 | 353.26 | 2.02 | 40.27 | 48.32 | 19.99 |
| 7 | Canada | 172.58 | 255.30 | 305.41 | 19.63 | 26.50 | 24.39 | -7.96 |
| 8 | Belgium | 237.72 | 272.70 | 266.44 | -2.30 | 29.59 | 26.22 | -11.39 |
| 9 | United Arab Emirates | 160.51 | 229.19 | 274.00 | 19.55 | 28.20 | 43.31 | 53.58 |
| 10 | France | 152.53 | 198.25 | 223.48 | 12.73 | 24.29 | 23.60 | -2.84 |
| 11 | Australia | 137.20 | 205.67 | 215.13 | 4.60 | 21.54 | 21.91 | 1.72 |
| 12 | China | 178.00 | 228.04 | 205.54 | -9.87 | 20.33 | 20.05 | -1.38 |
| 13 | Japan | 156.77 | 175.74 | 185.56 | 5.59 | 18.42 | 16.82 | -8.69 |
| 14 | Bangladesh | 131.98 | 179.77 | 180.87 | 0.61 | 18.12 | 19.51 | 7.67 |
| 15 | Mexico | 107.76 | 166.89 | 160.61 | -3.76 | 22.06 | 16.66 | -24.48 |
| Other Markets | 2,426.48 | 2,903.38 | 3,158.16 | 8.78 | 358.93 | 315.51 | -12.10 | |
| Total | 8,299.20 | 10,130.83 | 11,076.00 | 9.33 | 1,192.3 | 1,094.8 | -8.18 |
Exports to FTA Partners
In October 2022, exports to Free Trade Agreement (FTA) partners which represented 8.4 % of Sri Lanka’s total merchandise exports grew by 8.36 % y-o-y to US$ 91.63 Million. Increases in exports were recorded to India, (↑7.9% to US$ 83.82 Million) and Pakistan (↑12.7% to US$ 7.81 Million) due to growing exports of Petroleum oils.
During the period of January to October 2022, exports to Free Trade Agreement (FTA) partners accounted for 7 % of total merchandise exports with an increase of 10.02 % and amounting to US$ 792.16 Mn.
Although Exports to India have increased by 12.61 % y-o-y to US$ 725.85 Mn, exports to Pakistan have decreased by 12.08 % to US$ 66.31 Mn during the period compared to the corresponding period of 2021.
Growth in Exports to India was mainly supported by increased exports of Animal Feed (11.4 %), Arecanuts (61.66%), Woven fabrics (67.3%), and Wood pulp (29.77%) from January - October 2022.
Table 3: Export Regions
Values in US$ Mns
| Country | Jan-Oct 2020 | Jan-Oct 2021 | Jan-Oct 2022 | % Growth | Oct 2021 | Oct 2022 | % Growth |
| United States | 2,089.20 | 2,466.74 | 2,822.89 | 14.44 | 291.28 | 239.98 | -17.61 |
| European Union (EU) excluding UK | 1,865.38 | 2,397.64 | 2,571.00 | 7.23 | 275.17 | 278.73 | 1.29 |
| South Asia | 764.05 | 992.43 | 1,063.19 | 7.13 | 119.26 | 119.82 | 0.47 |
| Middle East Countries (Excl. Cyprus & Egypt) | 593.25 | 747.53 | 818.76 | 9.53 | 26.69 | 30.85 | 15.59 |
| African Countries | 207.36 | 260.47 | 257.75 | -1.04 | 28.47 | 23.77 | -16.51 |
| ASEAN Countries | 242.26 | 266.18 | 299.7 | 12.59 | 29.52 | 39.12 | 32.52 |
| CIS Countries | 230.07 | 209.12 | 205.31 | -1.82 | 20.37 | 29.32 | 43.94 |
| Others | 4,396.83 | 5,257.46 | 5,860.29 | 11.47 | 401.54 | 333.21 | -17.02 |
| Total Merchandise Exports | 8,299.20 | 10,130.83 | 11,076.00 | 9.33 | 1,192.3 | 1,094.8 | -8.18 |
Export of Services
The estimated value of services exports for the period of January - October 2022 was 1,619.66 Million dollars, increasing by 2.64 % over the corresponding period of 2021. The services exports estimated by EDB consist of ICT/BPM, Construction, Financial services, and Transport & Logistics.