
Earnings from the merchandise exports increased by 5.75 % y-o-y to US$ 1,093.98 Mn in September 2022 as per the data released by the Sri Lanka Customs.
This was mainly due to the increase in export earnings from Apparel & Textiles, Tea, Gems & Jewellery, Electrical & Electronic Components and Spices & Essential Oils.
Monthly Merchandize Export Performance, 2020 - September 2022 in Millions of US$
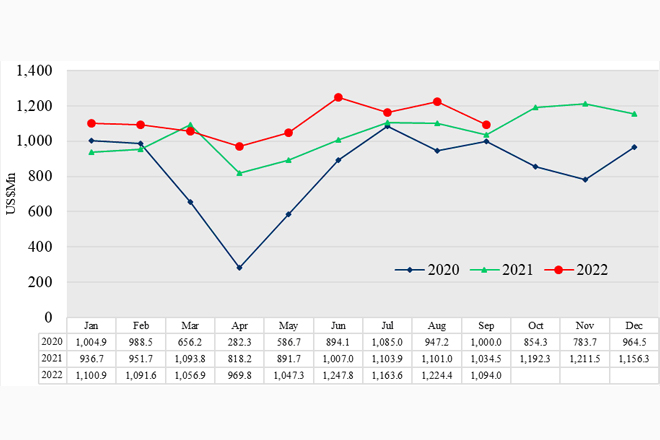
Table 1: Merchandise Export Performance
Values in US$ Mns
| Exports of Goods | Jan-Sept 2020 | Jan-Sept 2021 | Jan-Sept 2022 | % Growth | Sept 2021 | Sept 2022 | % Growth |
| Apparel & Textiles | 3,273.89 | 3,879.43 | 4,562.67 | 17.61 | 457.04 | 479.88 | 5.00 |
| Tea | 919.56 | 986.56 | 937.14 | -5.01 | 104.12 | 117.82 | 13.16 |
| Rubber-based | 586.82 | 805.02 | 787.87 | -2.13 | 96.09 | 82.19 | -14.47 |
| Coconut-based | 490.24 | 608.75 | 638.58 | 4.90 | 70.36 | 65.89 | -6.35 |
| Diamond, Gems & Jewelry | 119.01 | 187.05 | 293.71 | 57.02 | 16.46 | 58.88 | 257.72 |
| Electronics & Electronic Components | 330.82 | 420.96 | 488.67 | 16.08 | 42.68 | 57.27 | 34.18 |
| Spices and Essential Oils | 234.52 | 320.82 | 275.24 | -14.21 | 37.37 | 40.84 | 9.29 |
| Food & Beverages | 275.81 | 276.81 | 319.22 | 15.32 | 29.30 | 28.43 | -2.97 |
| Seafood | 149.38 | 188.06 | 205.31 | 9.17 | 22.60 | 16.95 | -25.00 |
| Ornamental Fish | 9.75 | 13.85 | 15.55 | 12.27 | 1.25 | 1.72 | 37.60 |
| Vegetables | 19.68 | 18.68 | 20.57 | 10.12 | 2.08 | 2.30 | 10.58 |
| Fruits & Nuts | 27.72 | 28.56 | 27.13 | -5.01 | 3.03 | 3.22 | 6.27 |
| Other Export Crops | 60.77 | 48.38 | 74.38 | 53.74 | 7.10 | 11.35 | 59.86 |
| Flowers & Foliage | 9.81 | 11.26 | 11.40 | 1.24 | 1.07 | 1.34 | 25.23 |
| Boat Building | 2.01 | 2.93 | 6.61 | 125.60 | 0.11 | 0.38 | 245.45 |
| Petroleum Products | 257.14 | 163.85 | 140.95 | -13.98 | 19.51 | 33.26 | 70.48 |
| Others | 677.97 | 977.52 | 1,191.19 | 21.86 | 124.33 | 92.26 | -25.79 |
| Total Merchandize Exports | 7,444.90 | 8,938.49 | 9,996.19 | 11.83 | 1,034.50 | 1,093.98 | 5.75 |
Table 2: Top 15 Export Destinations
Values in US$ Mns
| Country | Jan-Sept 2020 | Jan-Sept 2021 | Jan-Sept 2022 | % Growth | Sept 2021 | Sept 2022 | % Growth | |
| 1 | United States | 1,892.14 | 2,175.46 | 2,582.91 | 18.73 | 270.44 | 274.16 | 1.38 |
| 2 | United Kingdom | 664.21 | 679.55 | 758.93 | 11.68 | 75.01 | 76.37 | 1.81 |
| 3 | India | 453.67 | 566.94 | 642.03 | 13.24 | 61.06 | 71.57 | 17.21 |
| 4 | Germany | 430.00 | 544.94 | 567.93 | 4.22 | 63.52 | 53.18 | -16.28 |
| 5 | Italy | 330.24 | 418.69 | 477.24 | 13.98 | 45.33 | 62.98 | 38.94 |
| 6 | Netherlands | 202.48 | 306.00 | 304.93 | -0.35 | 35.86 | 30.66 | -14.50 |
| 7 | Canada | 156.62 | 228.80 | 281.03 | 22.83 | 28.15 | 26.45 | -6.04 |
| 8 | Belgium | 212.87 | 243.11 | 240.22 | -1.19 | 28.20 | 24.73 | -12.30 |
| 9 | United Arab Emirates | 146.23 | 200.99 | 230.69 | 14.78 | 20.26 | 39.59 | 95.41 |
| 10 | France | 136.67 | 173.95 | 199.88 | 14.91 | 21.23 | 22.10 | 4.10 |
| 11 | Australia | 122.84 | 184.13 | 193.23 | 4.94 | 18.72 | 22.66 | 21.05 |
| 12 | China | 159.28 | 207.71 | 185.49 | -10.70 | 21.04 | 20.04 | -4.75 |
| 13 | Japan | 143.48 | 157.32 | 168.74 | 7.26 | 21.53 | 18.42 | -14.44 |
| 14 | Bangladesh | 118.39 | 161.64 | 161.36 | -0.17 | 15.61 | 13.84 | -11.34 |
| 15 | Mexico | 95.15 | 144.83 | 143.95 | -0.61 | 18.69 | 22.44 | 20.06 |
| Other Markets | 2,180.63 | 2,544.43 | 2,857.63 | 12.31 | 289.81 | 314.79 | 8.62 | |
| Total | 7,444.90 | 8,938.49 | 9,996.19 | 11.83 | 1,034.50 | 1,093.98 | 5.75 |
Exports to FTA Partners
During the period of January to September 2022, exports to Free Trade Agreement (FTA) partners accounted for 7 % of total merchandise exports with an increase of 10.25 % and amounting to US$ 700.53 Mn.
Although Exports to India has increased by 13.24 % y-o-y to US$ 642.03 Mn, exports to Pakistan has decreased by 14.59% to US$ 58.5 Mn during the period compared to the corresponding period of 2021.
Growth in Exports to India was mainly supported by increased exports of Animal Feed (14.69%), Arecanuts (69.85%), Woven fabrics (77.45%) and Wood pulp (33.85%) from January - September 2022.
Table 3: Export Regions
Values in US$ Mns
| Country | Jan-Sept 2020 | Jan-Sept 2021 | Jan-Sept 2022 | % Growth | Sept 2021 | Sept 2022 | % Growth |
| United States | 1,892.14 | 2,175.46 | 2,582.91 | 18.73 | 270.44 | 274.16 | 1.38 |
| European Union (EU) excluding UK | 1,661.03 | 2,122.48 | 2,292.26 | 8.00 | 239.41 | 247.22 | 3.26 |
| South Asia | 693.48 | 873.17 | 943.36 | 8.04 | 92.8 | 100.63 | 8.44 |
| Middle East Countries (Excl. Cyprus & Egypt) | 541.86 | 625.02 | 720.10 | 15.21 | 66.35 | 95.87 | 44.49 |
| African Countries | 189.16 | 232.00 | 233.98 | 0.85 | 24.41 | 26.1 | 6.92 |
| Asean Countries | 222.70 | 236.66 | 260.58 | 10.11 | 29.39 | 55.3 | 88.16 |
| CIS Countries | 204.35 | 188.75 | 176.00 | -6.75 | 17.15 | 24.03 | 40.12 |
| Others | 2,040.18 | 2,484.95 | 2,787.00 | 12.16 | 294.55 | 270.67 | -8.11 |
| Total Merchandise Exports | 7,444.90 | 8,938.49 | 9,996.19 | 11.83 | 1,034.50 | 1,093.98 | 5.75 |
Export of Services
The estimated value of services exports for the period of January - September 2022 was 1,455.75 Million dollars, increasing 3.8 % over the corresponding period of 2021. The services exports estimated by EDB consists of ICT/BPM, Construction, Financial services and Transport & Logistics.