
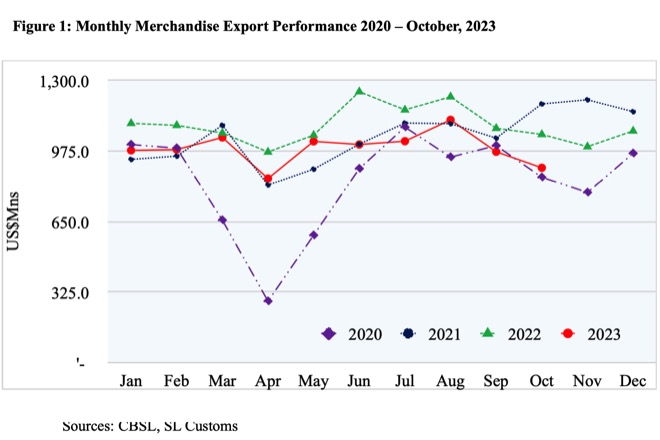
Sri Lanka’s merchandise exports decreased by 14.6 % to US$ 898.0 Million in October 2023 compared to October 2022 as per the provisional data released by the Sri Lanka Customs. Also, it is a 13.13 % decrease when compared to the value recorded in September 2023.
The decline in merchandise exports is due to decreased demand for export products, particularly in sectors such as Apparel & Textiles, Rubber & Rubber-based products, and Coconut & Coconut-based products.
Table 1: Comparison of Product-wise Merchandise Export Performance
Values in US$ Mns
| Exports of Goods | Jan-Oct 2022 | Jan-Oct 2023 | % Growth (22-23) | Oct 2022 | Oct 2023 | % Growth (22-23) |
| Apparel & Textile | 5,004.58 | 4,030.68 | -19.46 | 441.89 | 353.30 | -20.05 |
| Tea | 1,045.84 | 1,085.94 | 3.83 | 108.70 | 95.63 | -12.02 |
| Rubber-based | 874.20 | 771.86 | -11.71 | 86.31 | 79.70 | -7.66 |
| Coconut-based | 710.97 | 590.69 | -16.92 | 72.41 | 59.69 | -17.57 |
| Diamond, Gems & Jewelery | 337.97 | 342.49 | 1.34 | 44.28 | 36.37 | -17.86 |
| Electronics & Electronic Components | 400.69 | 414.26 | 3.39 | 46.26 | 37.59 | -18.74 |
| Spices and Concentrates | 311.63 | 335.39 | 7.62 | 36.39 | 32.70 | -10.14 |
| Processed Food & Beverages | 349.71 | 359.20 | 2.71 | 30.52 | 36.86 | 20.77 |
| Seafood | 224.88 | 213.24 | -5.18 | 19.56 | 20.29 | 3.73 |
| Ornamental Fish | 17.37 | 21.91 | 26.14 | 1.82 | 2.47 | 35.71 |
| Vegetables | 22.91 | 24.30 | 6.07 | 2.36 | 2.70 | 14.41 |
| Fruits | 30.92 | 36.24 | 17.21 | 3.76 | 3.93 | 4.52 |
| Other Export Crops | 82.84 | 83.82 | 1.18 | 8.46 | 9.19 | 8.63 |
| Flowers & Foliage | 12.59 | 12.30 | -2.30 | 1.18 | 1.23 | 4.24 |
| Boat Building | 16.60 | 67.53 | 306.81 | 9.99 | 0.28 | -97.20 |
| Petroleum Products | 220.25 | 325.49 | 47.78 | 79.30 | 30.67 | -61.32 |
| Others | 1,379.55 | 1,164.46 | -15.59 | 58.41 | 95.40 | 63.33 |
| Total Merchandize Exports | 11,043.50 | 9,879.80 | -10.54 | 1,051.60 | 898.00 | -14.61 |
Sources: CBSL, SL Customs
Table 2: Comparison of Merchandise Export Performance of Top 15 Export Destinations
Values in US$ Mns
|
| Destination | Jan-Oct 2022 | Jan-Oct 2023 | % Growth (22-23) | Oct 2022 | Oct 2023 | % Growth (22-23) |
| 1 | United States | 2,822.89 | 2,281.57 | -19.18 | 239.98 | 206.77 | -13.84 |
| 2 | United Kingdom | 829.15 | 709.09 | -14.48 | 70.22 | 63.35 | -9.78 |
| 3 | India | 725.85 | 720.84 | -0.69 | 83.82 | 65.23 | -22.18 |
| 4 | Germany | 633.81 | 484.28 | -23.59 | 65.88 | 45.87 | -30.37 |
| 5 | Italy | 535.84 | 571.48 | 6.65 | 58.59 | 64.16 | 9.51 |
| 6 | Netherlands | 353.26 | 270.92 | -23.31 | 48.32 | 24.48 | -49.34 |
| 7 | Canada | 305.41 | 249.76 | -18.22 | 24.39 | 19.76 | -18.98 |
| 8 | UAE | 274.00 | 301.67 | 10.10 | 43.31 | 21.95 | -49.32 |
| 9 | Belgium | 266.44 | 186.89 | -29.86 | 26.22 | 16.91 | -35.51 |
| 10 | France | 223.48 | 266.99 | 19.47 | 23.60 | 18.66 | -20.93 |
| 11 | Australia | 215.13 | 187.82 | -12.69 | 21.91 | 18.56 | -15.29 |
| 12 | China | 205.54 | 200.01 | -2.69 | 20.05 | 23.02 | 14.81 |
| 13 | Japan | 185.56 | 159.07 | -14.28 | 16.82 | 13.88 | -17.48 |
| 14 | Bangladesh | 180.87 | 149.76 | -17.20 | 19.51 | 10.99 | -43.67 |
| 15 | Mexico | 160.61 | 147.08 | -8.42 | 16.66 | 15.42 | -7.44 |
|
| Others | 3,125.66 | 2,992.57 | -4.26 | 272.32 | 268.99 | -1.22 |
|
| Total | 11,043.50 | 9,879.80 | -10.54 | 1051.60 | 898.00 | -14.61 |
Sources: CBSL, SL Customs
Table 3: Comparison of Region wise Merchandise Export Performance
Values in US$ Mns
| Region | Jan-Oct 2022 | Jan-Oct 2023 | % Growth (22-23) | Oct 2022 | Oct 2023 | % Growth (22-23) |
| United States | 2,822.89 | 2,281.57 | -19.18 | 239.98 | 206.77 | -13.84 |
| European Union (EU) excluding UK | 2,571.00 | 2,257.58 | -12.19 | 278.73 | 213.18 | -23.52 |
| South Asia | 1,063.19 | 1,029.73 | -3.15 | 119.82 | 92.02 | -23.20 |
| ASEAN | 818.76 | 851.05 | 3.94 | 98.66 | 73.05 | -25.96 |
| CIS Countries | 257.75 | 272.09 | 5.56 | 23.77 | 25.52 | 7.36 |
| African Countries | 299.70 | 276.20 | -7.84 | 39.12 | 24.45 | -37.50 |
| Middle East Countries (excl. Cyprus & Egypt) | 205.31 | 203.31 | -0.97 | 29.32 | 17.36 | -40.79 |
| Others | 3,004.90 | 2,708.27 | -9.87 | 222.20 | 245.65 | 10.55 |
| Total Merchandise Exports | 11,043.50 | 9,879.80 | -10.54 | 1051.60 | 898.00 | -14.61 |
Export of Services
The estimated value of services exports for the period of January to October 2023 was US$ 2,606.34 Mn, increasing 67.2 % over the corresponding period of 2022. The services exports estimated by EDB consists of ICT/BPM, Construction, Financial services and Transport & Logistics.