
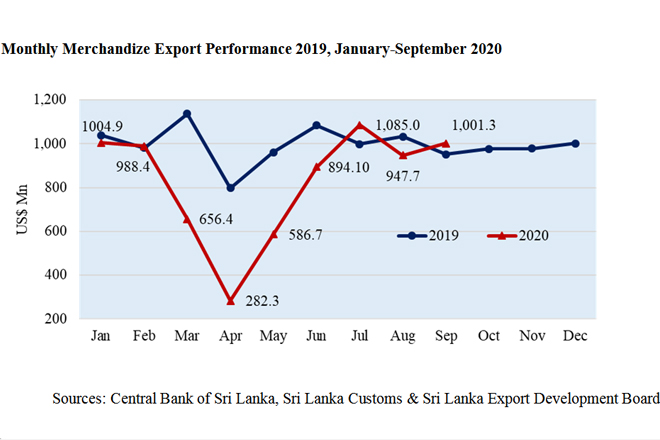
Oct 13, 2020 (LBO) – Sri Lanka’s merchandize exports have surpassed the US$ 1 billion mark in September after July during this year, statistics of the Export Development Board (EDB) showed.
As per the Customs statistics, earnings from merchandise exports recorded a positive growth of 5.16% in September 2020 to US$ 1,001.27 Mn as compared to the value of US$ 952.1 Mn recorded in September 2019.
This strong performance is consistent with the gradual lifting of restrictions due to Covid 19 pandemic within the country and globally.
Increases in exports were recorded as; Europe Region (20.19%), CIS Countries (19.59%) and African Region (56.4%) in September 2020 compared to September 2019.
Moreover, earnings from merchandise exports in September 2020 increased by 5.65 % compared with the value recorded in August 2020.
"It is the 3rd time this year we have seen a year on year increase of merchandise exports," EDB Chairman Prabhash Subasinghe said.
"However, we are concerned about the recent escalation of COVID-19 in Sri Lanka but hopeful of a swift recovery and a stable level of business continuity. Our businesses must continue to be resilient whilst facing the unknown and must have strong COVID-19 preventive measures in order to bring in the much-needed foreign currency for Sri Lanka.”
Merchandise Export Performance
Values in US$ Mns
| Exports of Goods | Jan.- Sept 2019 | Jan.- Sept 2020 | % Growth | Sept 2019 | Sept 2020 | % Growth |
| Apparel | 4,172.84 | 3,273.9 | -21.54 | 448.68 | 431.87 | -3.75 |
| Tea | 1,025.35 | 919.56 | -10.32 | 110.35 | 113.99 | 3.30 |
| Rubber-based | 682.16 | 586.58 | -14.01 | 72.38 | 80.01 | 10.54 |
| Coconut-based | 472.85 | 490.24 | 3.68 | 49.34 | 68.53 | 38.89 |
| Spices and Essential Oils | 235.34 | 234.41 | -0.40 | 31.36 | 38.93 | 24.14 |
| Electricals & Electronic Components | 291.03 | 246.23 | -15.39 | 32.63 | 37.01 | 13.42 |
| Food & Beverages | 269.88 | 275.82 | 2.20 | 24.02 | 29.64 | 23.40 |
| Diamond, Gems & Jewelry | 238.51 | 119.01 | -50.10 | 41.11 | 20.32 | -50.57 |
| Seafood | 200.39 | 149.38 | -25.46 | 15.94 | 16.22 | 1.76 |
| Ornamental Fish | 11.36 | 9.75 | -14.17 | 1.22 | 1.29 | 5.74 |
| Vegetables | 23.82 | 19.68 | -17.38 | 2.77 | 2.32 | -16.25 |
| Fruits | 31.66 | 27.72 | -12.44 | 3.61 | 3.20 | -11.36 |
| Other Export Crops | 24.48 | 60.77 | 148.24 | 4.10 | 4.49 | 9.51 |
| Flowers & Foliage | 14.36 | 9.81 | -31.69 | 1.42 | 1.16 | -18.31 |
| Boat Building | 64.44 | 2.01 | -96.88 | 0.69 | 0.09 | -86.96 |
| Petroleum Products | 242.55 | 257.14 | 6.02 | 21.58 | 29.86 | 38.37 |
| Others | 871.55 | 719.47 | -17.45 | 90.9 | 122.34 | 34.59 |
| Total Merchandize Exports | 8,872.57 | 7,401.48 | -16.58 | 952.10 | 1,001.27 | 5.16 |
Sources: Sri Lanka Customs / Sri Lanka Export Development Board
Export of Services
The services exports estimated by EDB which includes ICT/BPM, Construction, Financial services and Transport & Logistics show exports of US $ 2,291.8 Mn for the period of January to September 2020 compared to US$ 2,911.7 Mn recorded in the corresponding period of the previous year.
However, estimated service exports declined by 21.29 % during the period of January to September 2020 compared with the corresponding period of previous year.
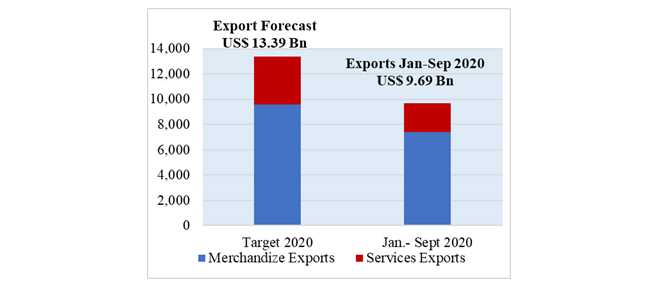
Revised Export Target & Achievement
The revised export target of the Export Development Board for 2020 is US$ 13.39 billion and of that we expect US$ 9.57 billion from merchandise exports and US$ 3.82 billion from services exports.
During the period January to September 2020, earnings from exports recorded US$ 9.69 billion including the estimated services data for July to September and 72.4% achieved from the revised export target.
Further, earnings from Merchandise exports and services exports achieved 77.33 % and 60.06% respectively during the period of January to September 2020.
Sri Lanka’s Top Export Destinations
Values in US$ Mns
| Country | Jan.- Sept 2019 | Jan.- Sept 2020 | % Growth | Sept 2019 | Sept 2020 | % Growth |
| United States of America | 2,337.29 | 1,892.14 | -19.05 | 254.04 | 239.98 | -5.53 |
| United Kingdom | 774.69 | 664.21 | -14.26 | 80.52 | 111.74 | 38.77 |
| India | 576.35 | 453.67 | -21.29 | 58.63 | 56.71 | -3.27 |
| Germany | 492.13 | 430.00 | -12.62 | 51.20 | 58.95 | 15.14 |
| Italy | 398.26 | 330.24 | -17.08 | 45.18 | 49.74 | 10.09 |
| Belgium | 260.26 | 212.87 | -18.21 | 26.35 | 29.60 | 12.33 |
| Netherlands | 217.40 | 202.48 | -6.86 | 24.19 | 30.02 | 24.10 |
| United Arab Emirates | 204.31 | 146.23 | -28.43 | 19.61 | 18.35 | -6.43 |
| Canada | 183.46 | 156.62 | -14.63 | 20.90 | 23.68 | 13.30 |
| China | 170.45 | 159.28 | -6.55 | 15.57 | 20.54 | 31.92 |
| Japan | 229.59 | 143.48 | -37.51 | 15.32 | 15.96 | 4.18 |
| Turkey | 157.39 | 153.93 | -2.20 | 15.46 | 22.31 | 44.31 |
| Other Markets | 2870.99 | 2456.33 | -14.44 | 325.13 | 323.69 | -0.44 |
| Total | 8872.57 | 7401.48 | -16.58 | 952.10 | 1001.27 | 5.16 |
Sources: Sri Lanka Customs / Sri Lanka Export Development Board
Sri Lanka’s Export Regions
Values in US$ Mns
| Region | Jan.- Sept 2019 | Jan.- Sept 2020 | % Growth | Sept 2019 | Sept 2020 | % Growth |
| European Union | 2,688.15 | 2,325.24 | -13.50 | 289.07 | 347.42 | 20.19 |
| United States | 2,337.29 | 1,892.14 | -19.05 | 254.04 | 239.98 | -5.53 |
| South Asia | 839.92 | 693.48 | -17.43 | 89.83 | 88.89 | -1.05 |
| Asean Countries | 310.7 | 222.7 | -28.32 | 29.49 | 25.91 | -12.14 |
| CIS Countries | 207.56 | 204.35 | -1.55 | 23.63 | 28.26 | 19.59 |
| African Countries | 200.37 | 189.16 | -5.59 | 17.04 | 26.65 | 56.40 |
| Middle East Countries (Excl. Cyprus & Egypt) | 680.48 | 541.86 | -20.37 | 65.35 | 65.89 | 0.83 |
| Others | 1,608.10 | 1,332.55 | -17.14 | 183.65 | 178.27 | -2.93 |
| Total Merchandise Exports | 8,872.57 | 7,401.48 | -16.58 | 952.10 | 1,001.27 | 5.16 |
Sources: Sri Lanka Customs / Sri Lanka Export Development Board