

Sri Lanka’s Export Earnings Exceed USD 14.4 Bn Mark in First Ten Months of 2025
Sri Lanka’s export sector has continued its strong upward trajectory, recording a significant 6.0 % growth during the period from January to October 2025. According to data released by Sri Lanka Customs, along with estimated figures for Gems & Jewellery and Petroleum Products, total exports reached US$ 14,433.82 Mn, surpassing the performance of the corresponding period in 2024. This also marks the first time that exports have exceeded the fourteen-billion-dollar mark within the first ten months of a year.
A key highlight is that exports of coconut-based products surpassed the US$ 1 billion mark during this period for the first time.
Commenting on this achievement, Mr. Mangala Wijesinghe, Chairman and Chief Executive Officer of the Export Development Board (EDB), stated:
“This is the highest-ever export figure recorded for the January–October period in Sri Lanka’s history. The continued recovery of key Western markets, along with the steady production capacity maintained by local industries, has played a pivotal role in driving this growth. I commend our exporters for their resilience and outstanding performance. Notably, 80% of the annual export target of US$ 18 billion has already been realized during this period.”
In October 2025 alone, total exports, comprising both merchandise and services reached to US$ 1,474.38 Mn, reflecting a month-on-month increase of 2.2 % compared with September 2025. However, this also represents a slight year-on-year increase of 0.16% compared with October 2024.
Despite the marginal annual decrease, the October performance underscores the resilience of Sri Lanka’s export sector and the continued effectiveness of strategies aimed at expanding market access and strengthening global competitiveness.
Meanwhile, services exports have emerged as a key driver of overall export growth. In October 2025, earnings from services exports estimated to be US$ 316.14 Mn. Over the first ten months of the year, services exports are estimated to have increased by 4.01 %, reaching US$ 3,060.21 Mn. This trend highlights the rising importance of Sri Lanka’s knowledge-based economy and its growing contribution to national export earnings.
The services export sector, comprising ICT/BPM, Construction, Financial services, and Transport & Logistics, continues to diversify Sri Lanka’s export portfolio and create high-value employment opportunities across the Island.
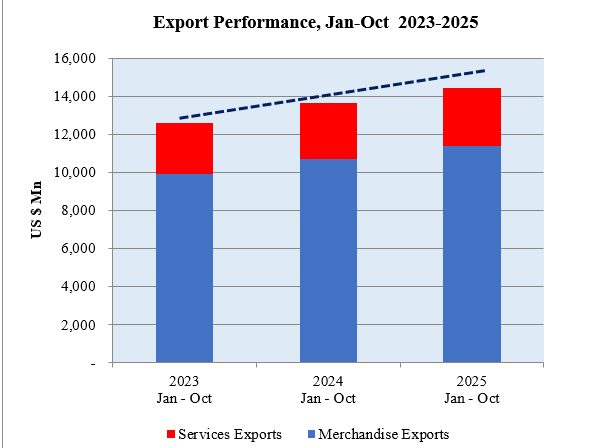
Table 1: Comparison of Product-wise Merchandise Export Performance
Values in US$ Mns
| Exports of Goods & Services |
2024 Jan – Oct |
2025 Jan – Oct |
% Growth (24-25) |
2024 Oct |
2025 Oct |
% Growth (24-25) |
| Apparel & Textiles | 4,206.95 | 4,440.85 | 5.56 | 430.21 | 429.17 | -0.24 |
| Tea | 1,186.10 | 1,289.58 | 8.72 | 126.81 | 126.55 | -0.21 |
| Rubber-based | 843.61 | 793.70 | -5.92 | 84.69 | 80.12 | -5.40 |
| Coconut-based | 718.25 | 1,033.09 | 43.83 | 77.26 | 123.97 | 60.46 |
| Diamond, Gems & Jewelery | 337.67 | 338.75 | 0.32 | 30.93 | 39.20 | 26.74 |
| Electrical & Electronics | 347.30 | 354.73 | 2.14 | 36.85 | 38.76 | 5.18 |
| Spices and Essential Oils | 373.40 | 368.24 | -1.38 | 51.30 | 38.39 | -25.17 |
| Food & Beverages | 400.27 | 499.90 | 24.89 | 59.29 | 71.25 | 20.17 |
| Seafood | 196.36 | 199.92 | 1.81 | 16.98 | 15.36 | -9.54 |
| Ornamental Fish | 20.69 | 19.57 | -5.41 | 1.97 | 1.60 | -18.78 |
| Vegetables | 24.15 | 29.98 | 24.14 | 2.84 | 2.36 | -16.90 |
| Fruits & Nuts | 34.48 | 41.48 | 20.30 | 3.97 | 4.08 | 2.77 |
| Other Export Crops | 53.96 | 79.90 | 48.07 | 4.15 | 9.23 | 122.41 |
| Flowers & Foliage | 11.53 | 12.45 | 7.98 | 1.21 | 1.33 | 9.92 |
| Boat Building | 40.35 | 36.94 | -8.45 | 14.60 | 0.24 | -98.36 |
| Petroleum Products | 905.50 | 802.88 | -11.33 | 121.44 | 83.00 | -31.65 |
| Others | 975.47 | 1,031.65 | 5.76 | 93.49 | 93.63 | 0.14 |
| Total Merchandise Exports | 10,676.04 | 11,373.60 | 6.53 | 1,158.00 | 1,158.24 | 0.02 |
| ICT/ BPM | 1,221.19 | 1,334.09 | 9.25 | 121.93 | 154.50 | 26.71 |
| Construction | 191.48 | 115.19 | -39.84 | 22.58 | 13.33 | -40.98 |
| Financial Services | 47.51 | 38.74 | -18.46 | 2.58 | 3.81 | 47.60 |
| Transport & Logistics | 1,482.16 | 1,572.19 | 6.07 | 166.94 | 144.50 | -13.44 |
| Total Services Exports | 2,942.34 | 3,060.21 | 4.01 | 314.04 | 316.14 | 0.67 |
| Total Goods & Services Exports | 13,618.38 | 14,433.82 | 5.99 | 1,472.04 | 1,474.38 | 0.16 |
Table 2: Comparison of Merchandise Export Performance of Top 15 Export Destinations
Values in US$ Mns
|
| Destination |
2024 Jan – Oct |
2025 Jan – Oct |
% Growth (24-25) |
2024 Oct |
2025 Oct |
% Growth (24-25) |
| 1 | United States | 2,432.78 | 2,498.04 | 2.68 | 247.33 | 246.20 | -0.46 |
| 2 | India | 726.57 | 866.90 | 19.31 | 82.79 | 74.49 | -10.03 |
| 3 | United Kingdom | 765.67 | 792.10 | 3.45 | 74.36 | 70.36 | -5.38 |
| 4 | Germany | 505.21 | 572.90 | 13.40 | 63.33 | 66.12 | 4.41 |
| 5 | Italy | 526.83 | 597.78 | 13.47 | 49.50 | 61.84 | 24.93 |
| 6 | Netherlands | 280.50 | 290.11 | 3.43 | 24.26 | 30.82 | 27.04 |
| 7 | United Arab Emirates | 316.48 | 390.68 | 23.45 | 30.91 | 44.02 | 42.41 |
| 8 | Canada | 222.92 | 236.53 | 6.11 | 23.68 | 23.84 | 0.68 |
| 9 | France | 270.24 | 272.57 | 0.86 | 27.07 | 27.70 | 2.33 |
| 10 | China | 206.86 | 224.80 | 8.67 | 20.34 | 23.53 | 15.68 |
| 11 | Australia | 202.25 | 214.11 | 5.86 | 21.54 | 19.85 | -7.85 |
| 12 | Belgium | 196.59 | 210.32 | 6.98 | 22.51 | 22.83 | 1.42 |
| 13 | Hong Kong | 107.35 | 169.31 | 57.72 | 9.43 | 13.91 | 47.51 |
| 14 | Switzerland | 140.32 | 161.87 | 15.36 | 13.55 | 15.02 | 10.85 |
| 15 | Iraq | 126.51 | 164.65 | 30.15 | 14.68 | 18.24 | 24.25 |
| 16 | Other Markets | 3,648.96 | 3,710.93 | 1.70 | 432.72 | 399.47 | -7.68 |
| Total Merchandise Exports | 10,676.04 | 11,373.60 | 6.53 | 1,158.00 | 1,158.24 | 0.02 |
Table 3: Comparison of Region wise Merchandise Export Performance
Values in US$ Mns
| Region |
2024 Jan – Oct |
2025 Jan – Oct |
% Growth (24-25) |
2024 Oct |
2025 Oct |
% Growth (24-25) |
| NAFTA | 2,851.12 | 2,920.98 | 2.45 | 291.20 | 291.26 | 0.02 |
| European Union (EU) excluding UK | 2,283.97 | 2,613.59 | 14.43 | 252.29 | 283.99 | 12.56 |
| South Asia | 1,125.53 | 1,162.51 | 3.29 | 162.56 | 110.19 | -32.22 |
| Middle East Countries (Excl. Cyprus & Egypt) | 808.02 | 882.66 | 9.24 | 75.41 | 89.73 | 18.99 |
| African Countries | 262.23 | 346.78 | 32.24 | 32.44 | 32.59 | 0.46 |
| ASEAN Countries | 289.46 | 377.43 | 30.39 | 24.05 | 55.20 | 129.52 |
| CIS Countries | 238.01 | 225.57 | -5.23 | 27.67 | 20.74 | -25.05 |
| Others | 2,817.70 | 2,844.08 | 0.94 | 292.38 | 274.54 | -6.10 |
| Total Merchandise Exports | 10,676.04 | 11,373.60 | 6.53 | 1,158.00 | 1,158.24 | 0.02 |